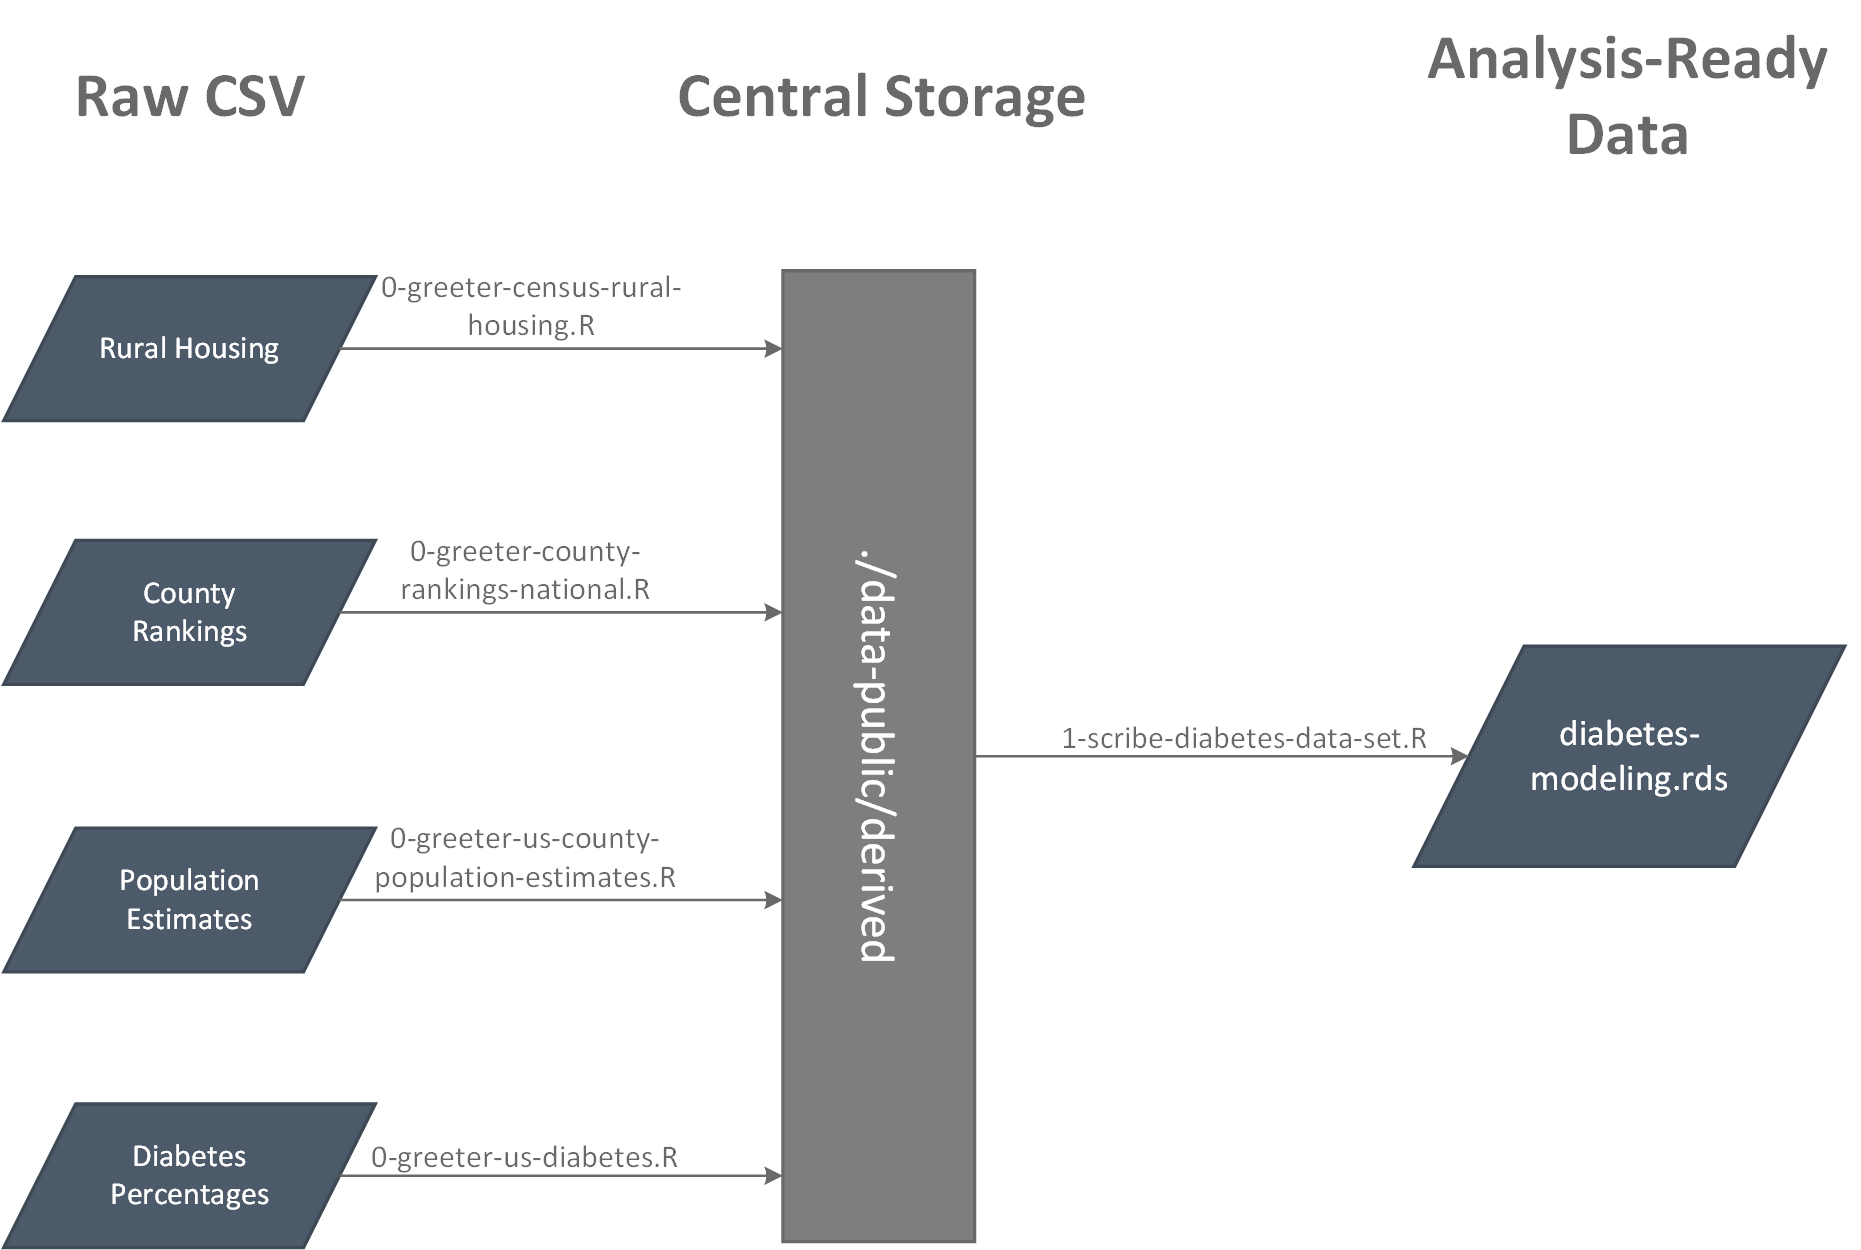
This is the second post in the series exploring Diabetes in rural North Carolina. This post will explore the data used for this project, from collection, cleaning, and analysis ready data.
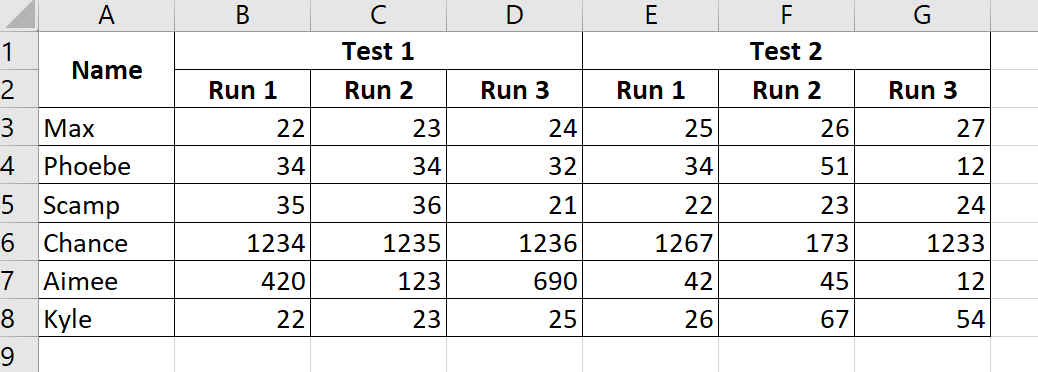
A solution for importing Excel Data that contains two header rows.
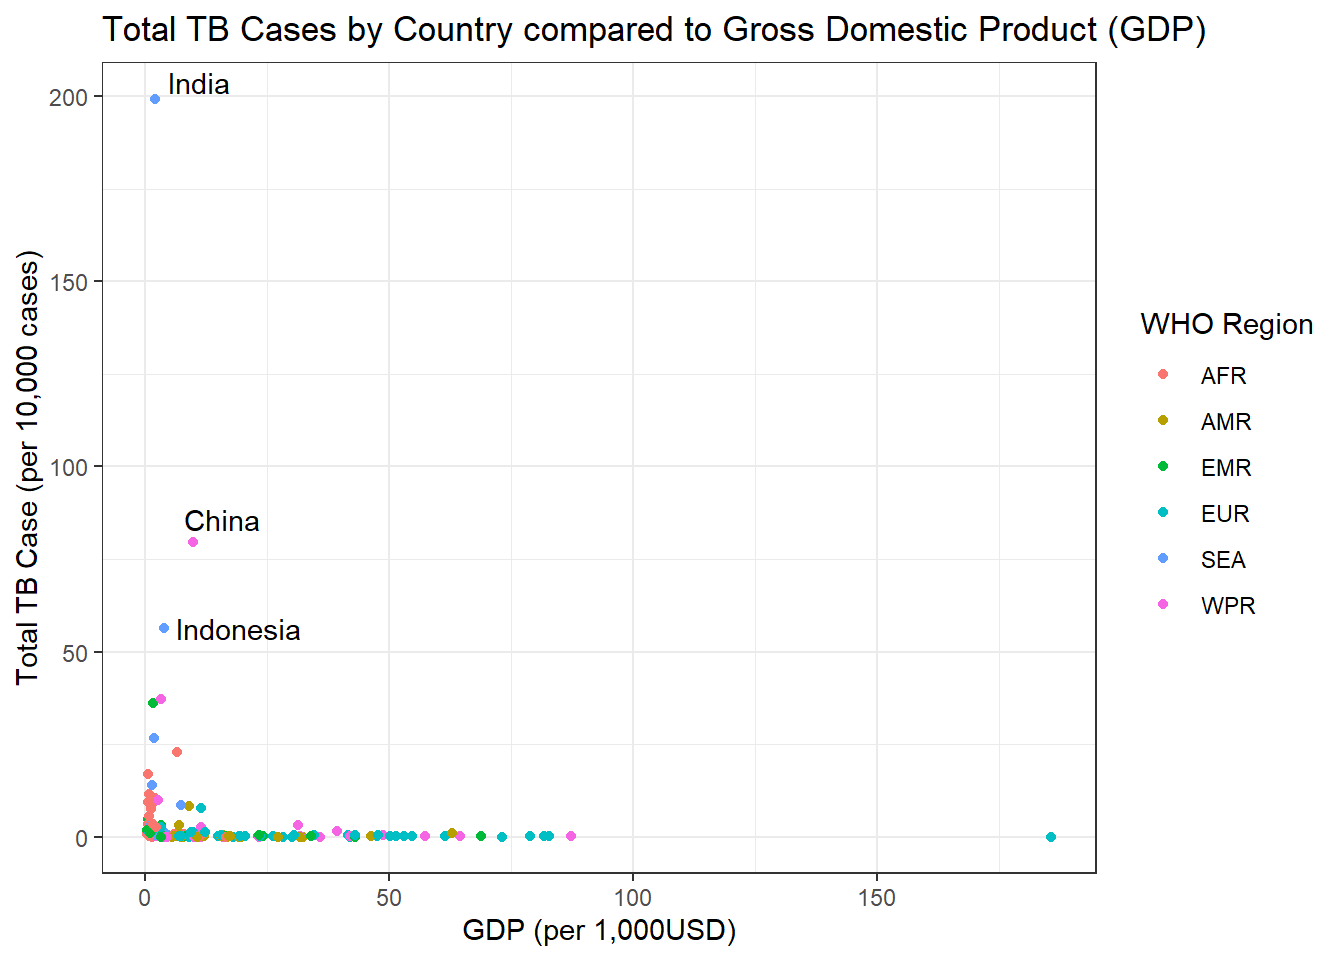
Today I am going to dive into some real life data from the World Health Organization (WHO), exploring new and relapse cases of Tuberculosis. I clean up the data, and then make a few graphs to explore different variables.
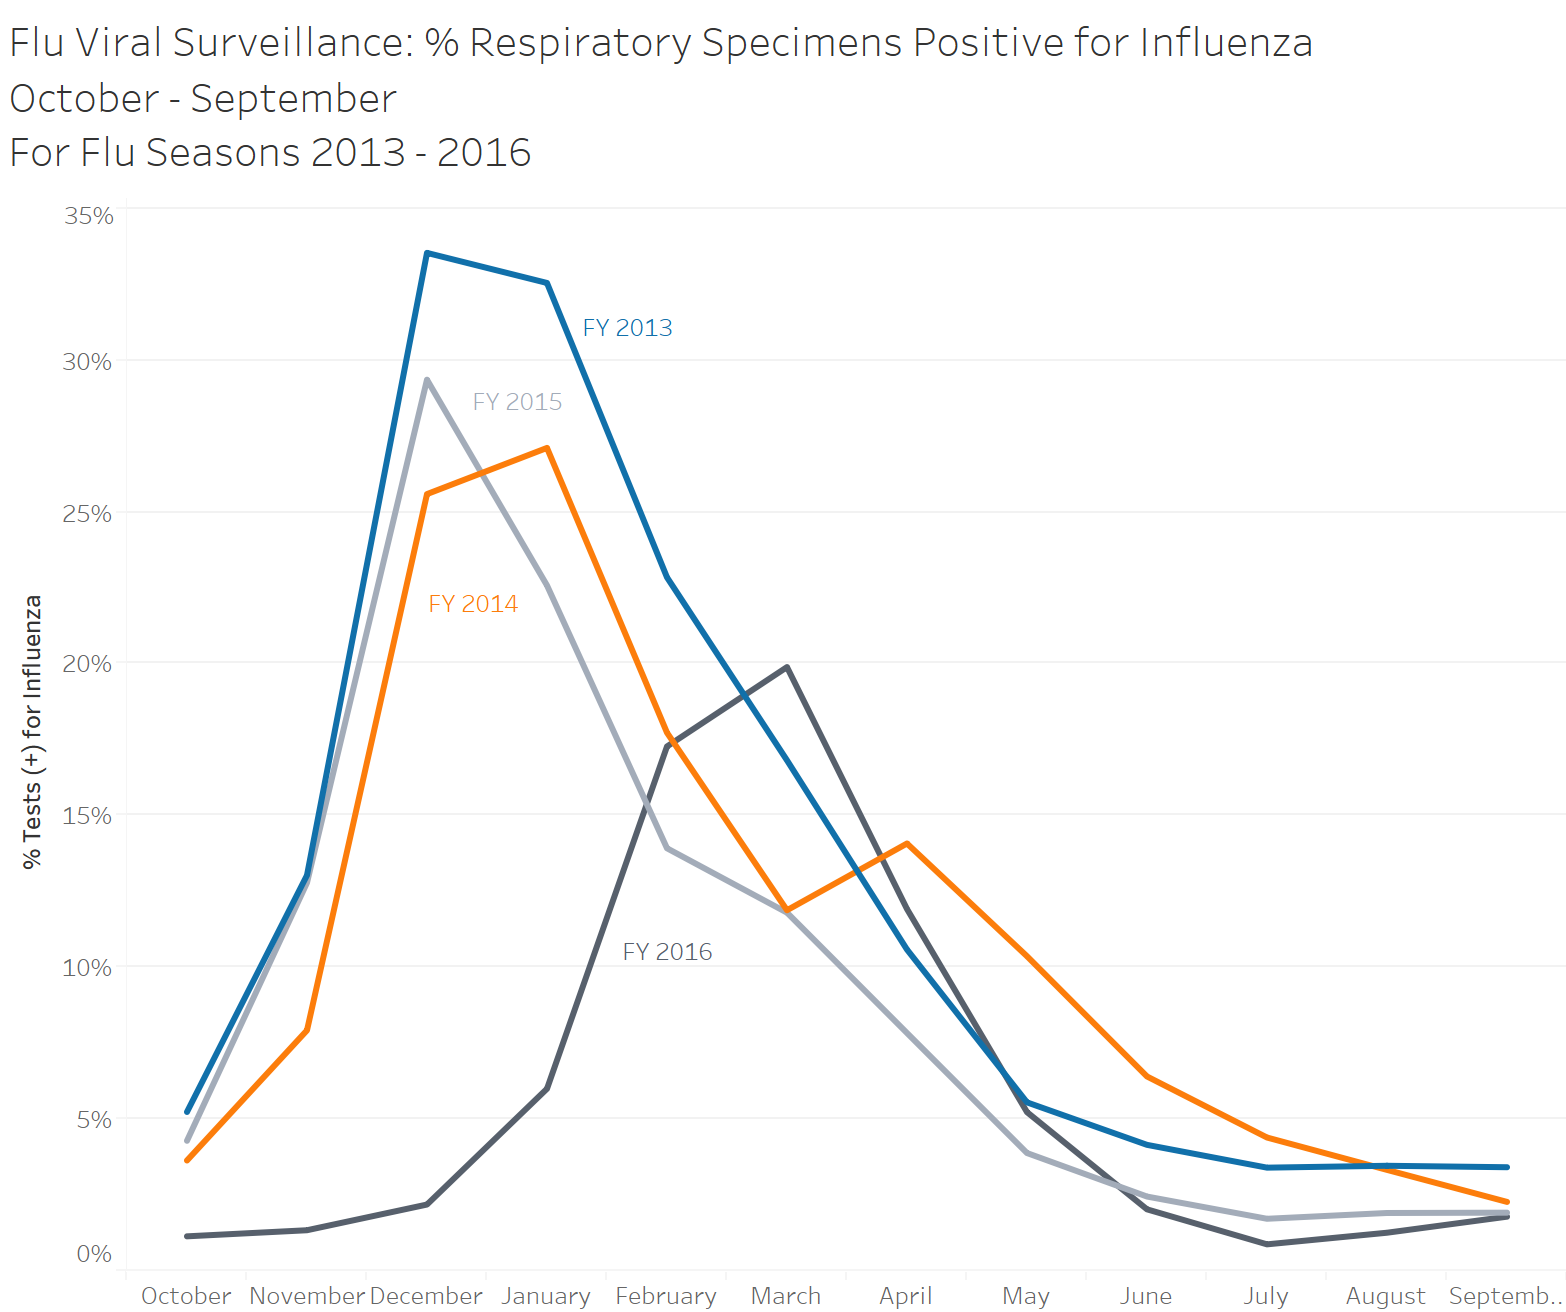
Tableau for Healthcare Chapter 10. Static and Interactive examples
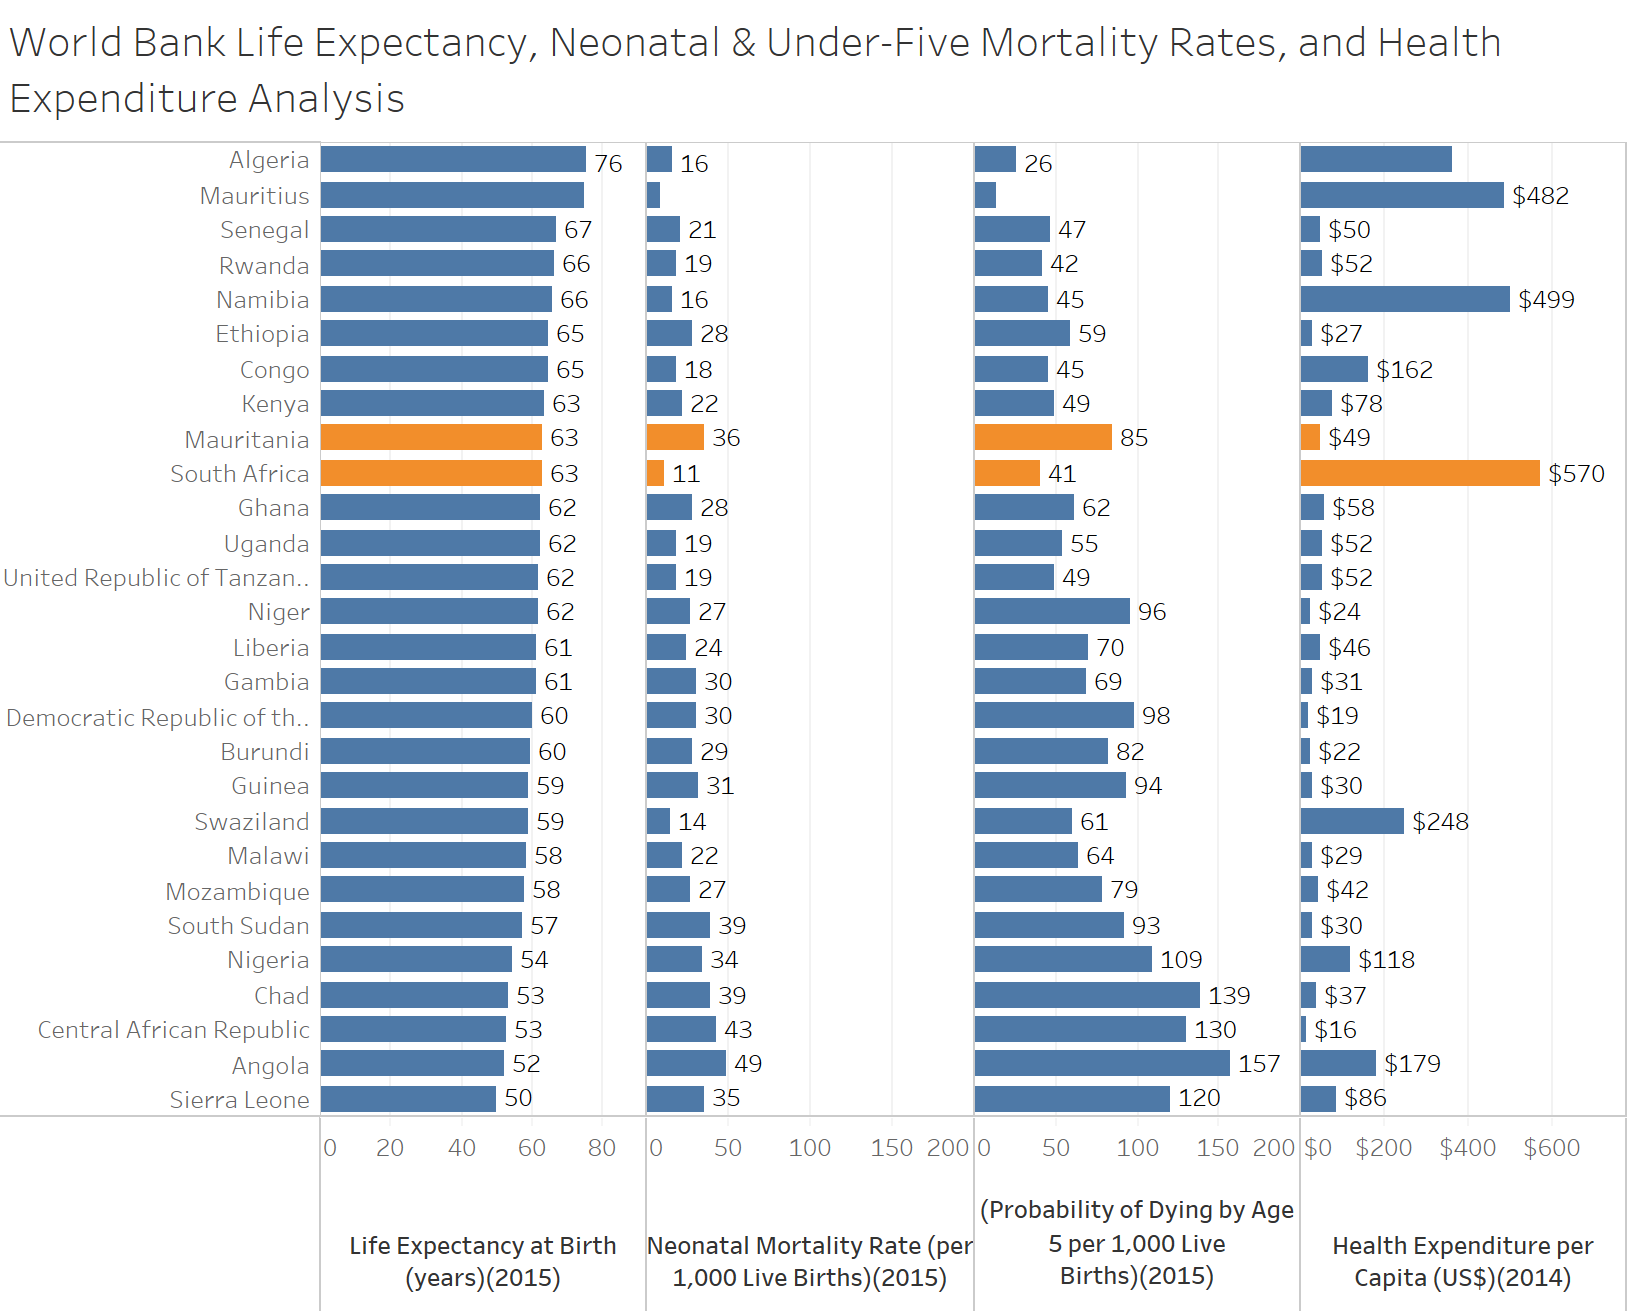
A look at Tableau for Healthcare Chapter 8. Table Lens graph.
A short introduction to my blog, and R journey.