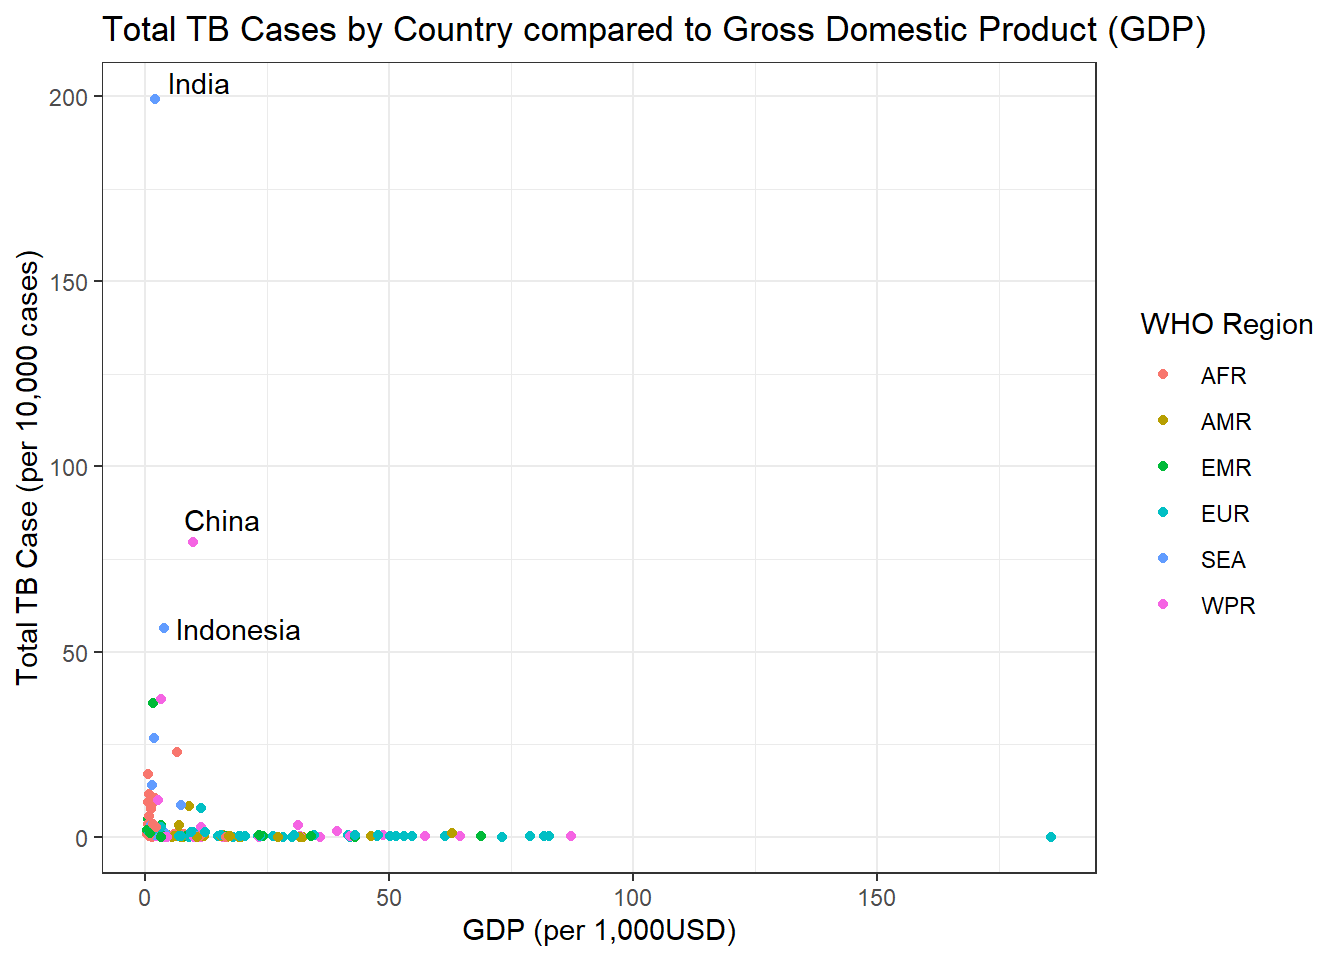
Today I am going to dive into some real life data from the World Health Organization (WHO), exploring new and relapse cases of Tuberculosis. I clean up the data, and then make a few graphs to explore different variables.
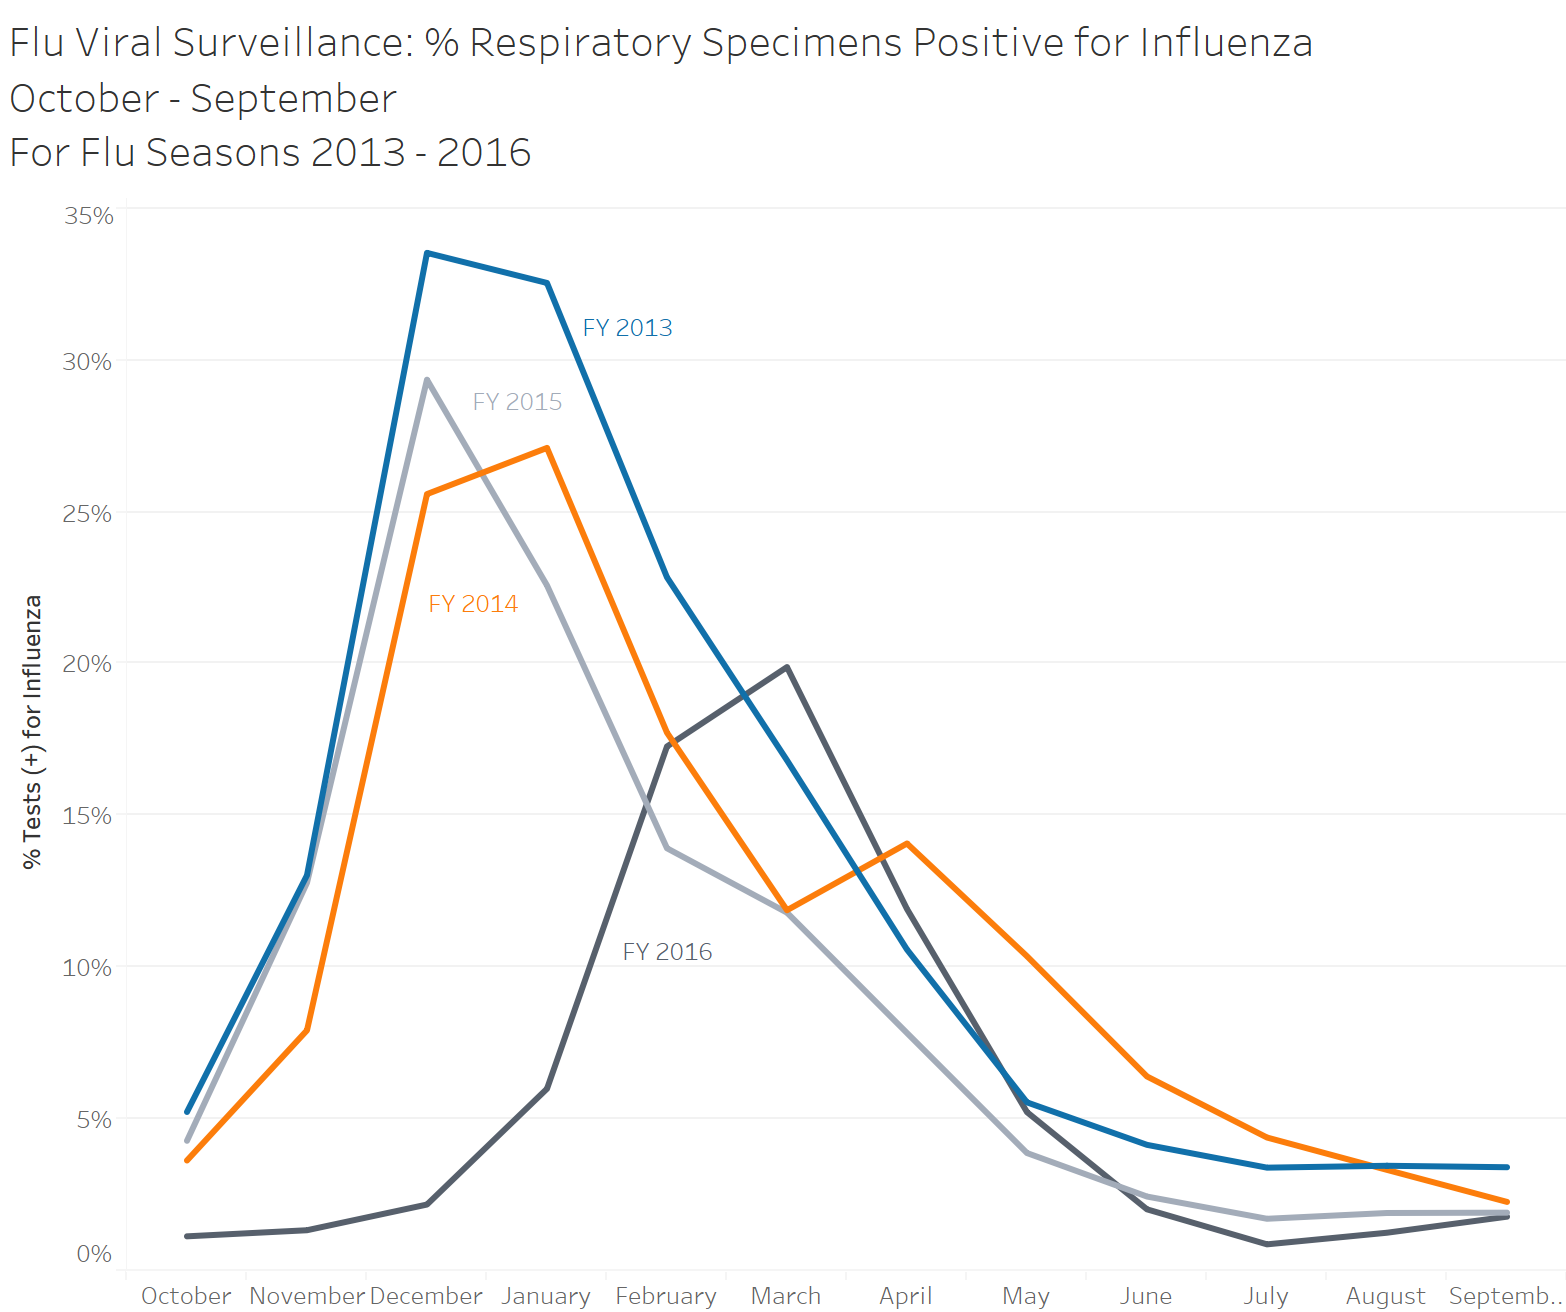
Tableau for Healthcare Chapter 10. Static and Interactive examples
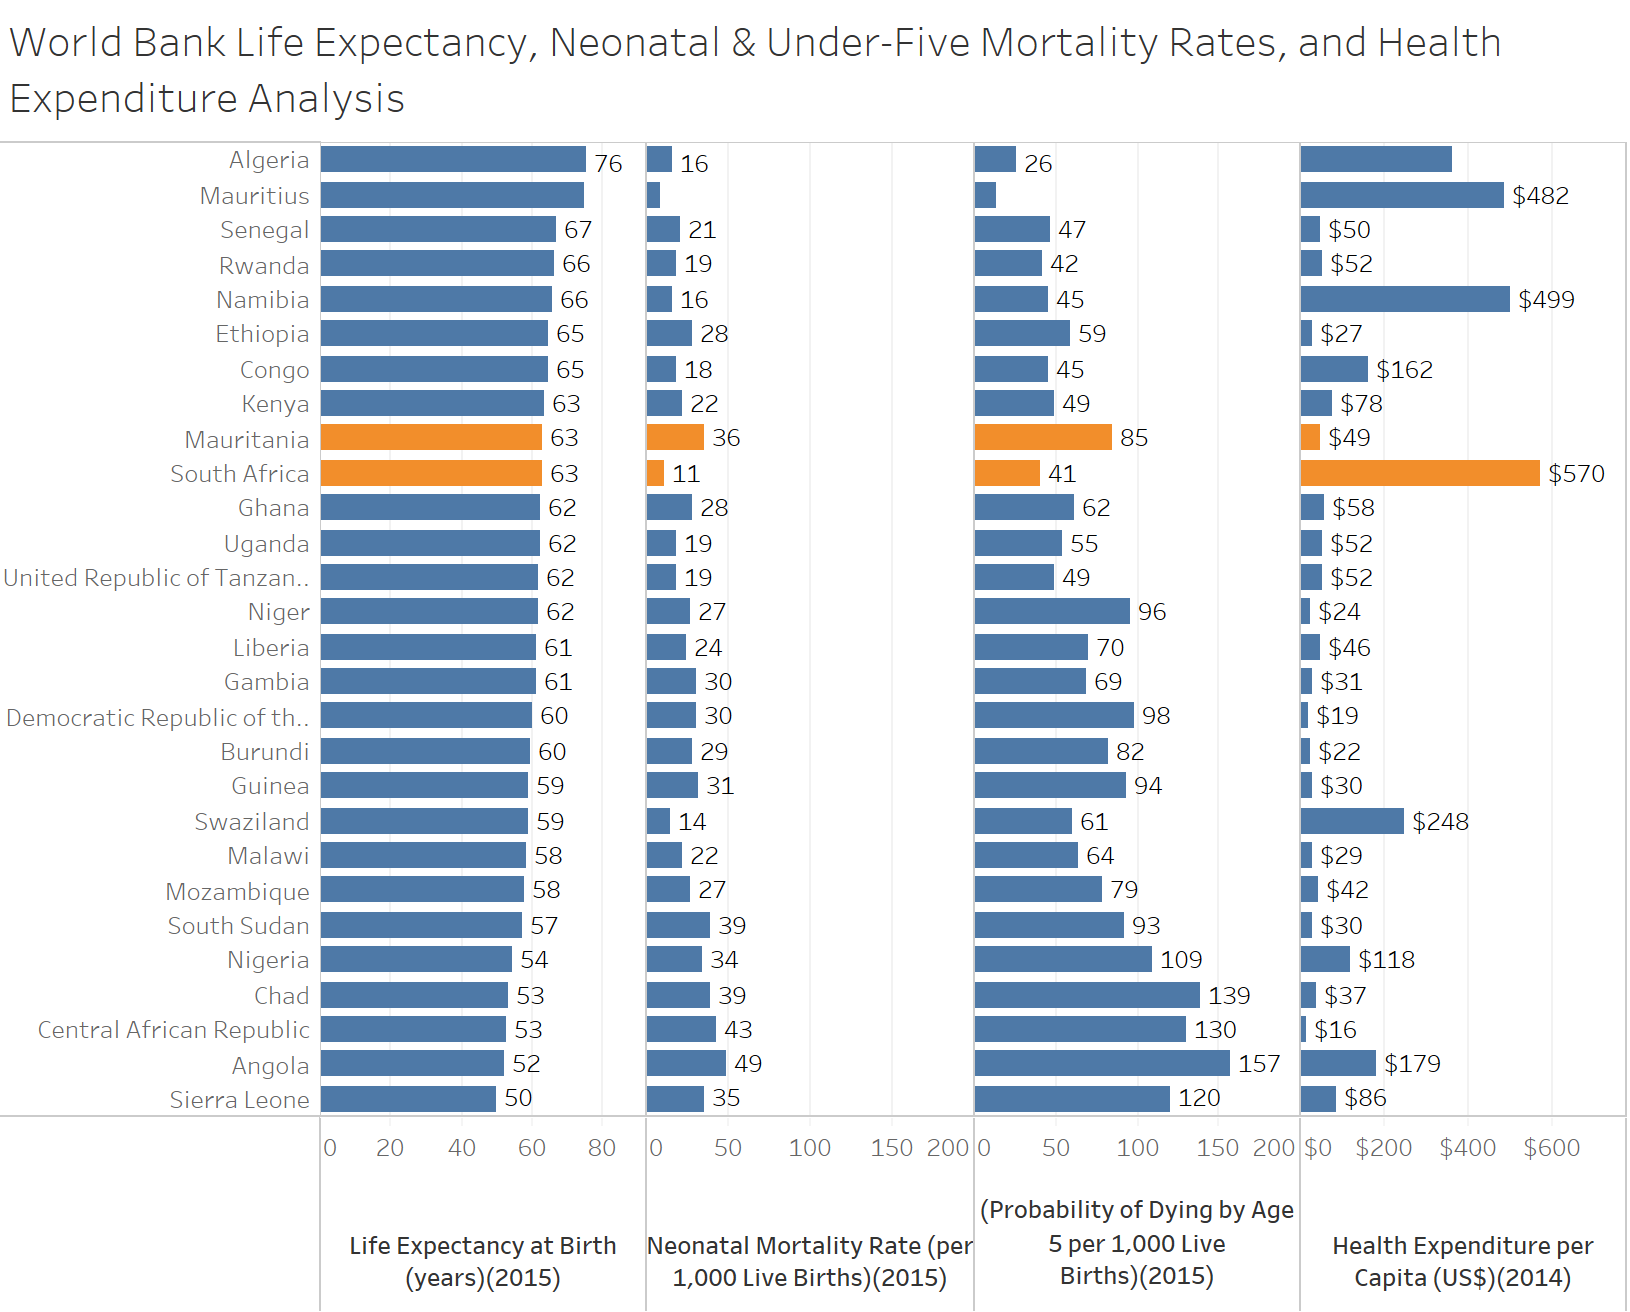
A look at Tableau for Healthcare Chapter 8. Table Lens graph.
A short introduction to my blog, and R journey.